
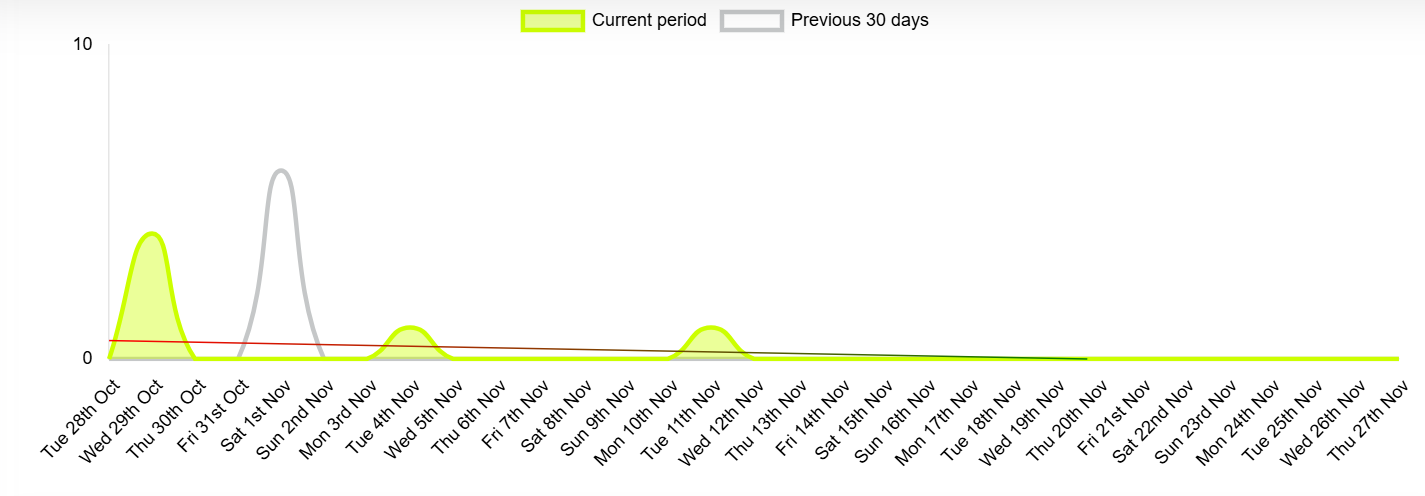
Incursion Trends
Log on to the Zonr portal and view incursion trends, filtering by Company, Group and date ranges.
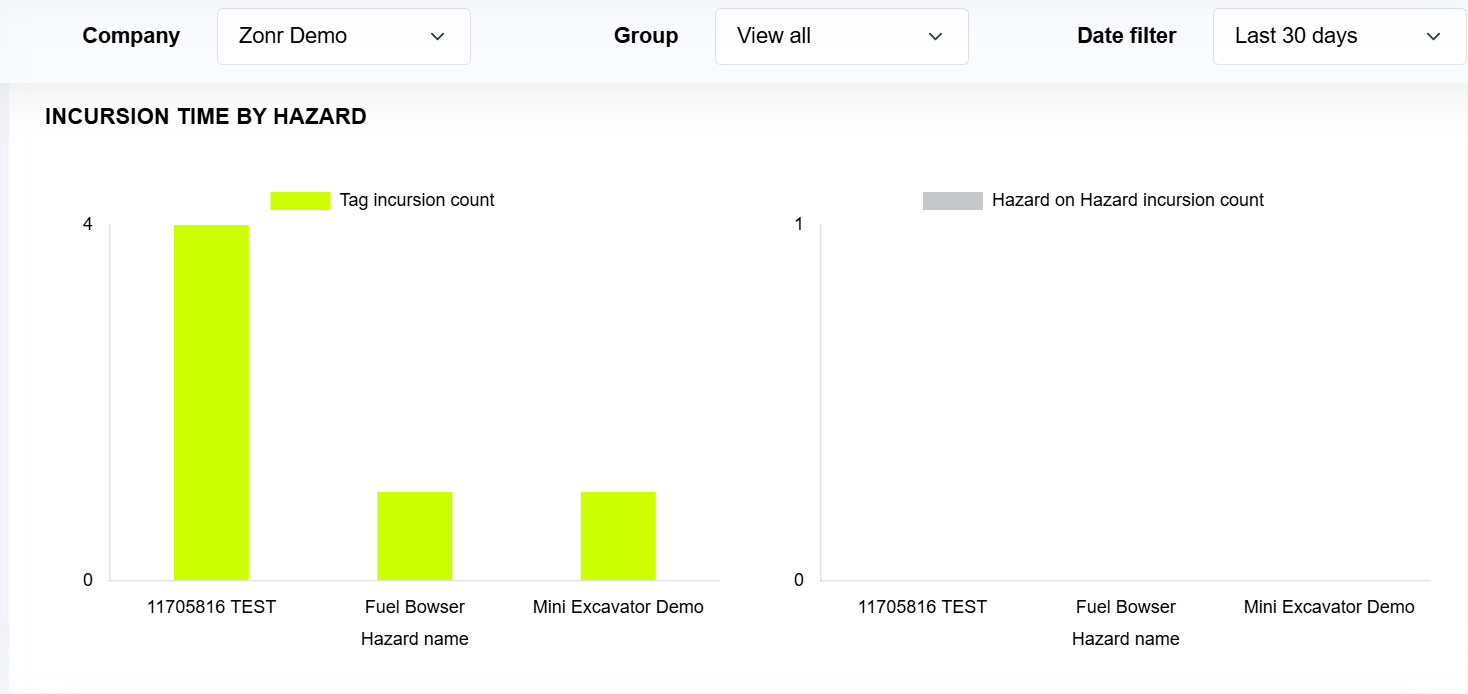
Dashboard
Graphs
Incursions
Incursion Count by Hazard
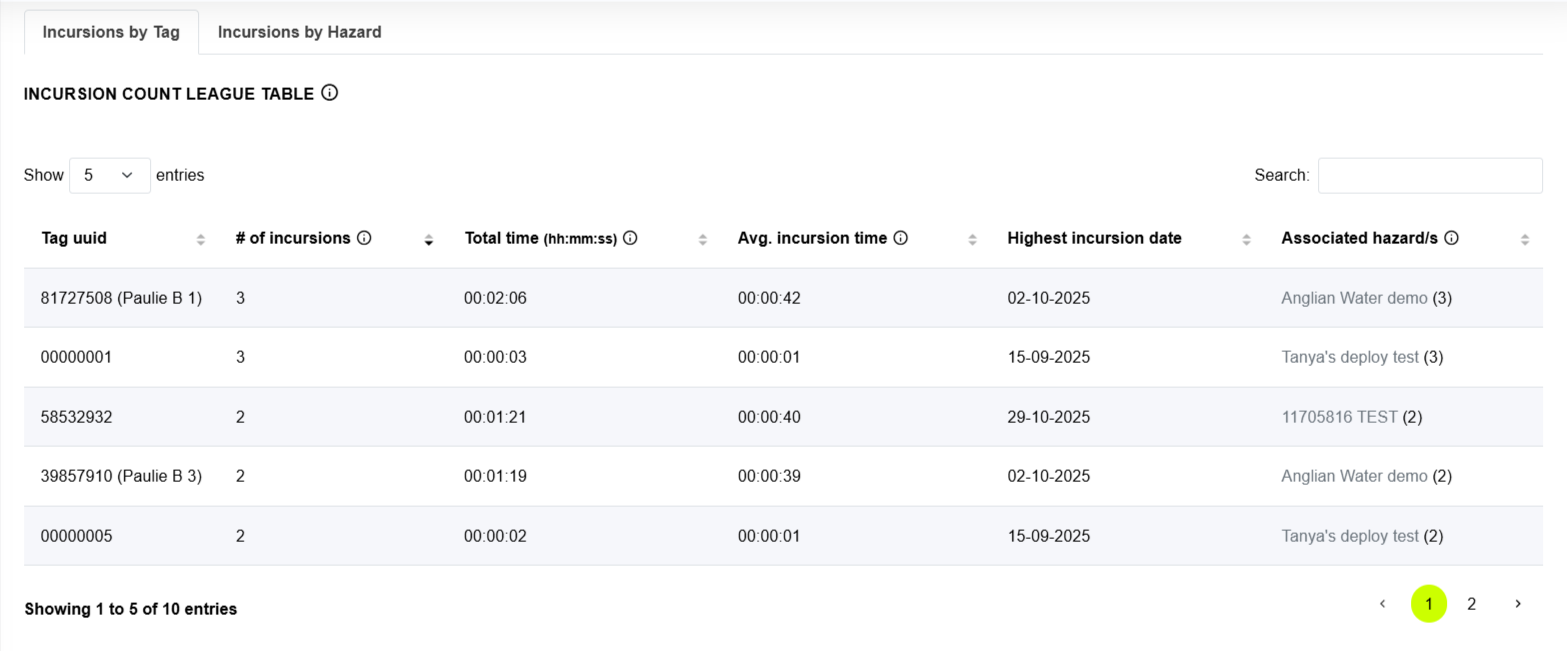
Incursion Count League Table
Last updated